Generating Usage by Subscriber Reports
The page shows information about the top 15 subscribers with the highest data usage during the selected period.
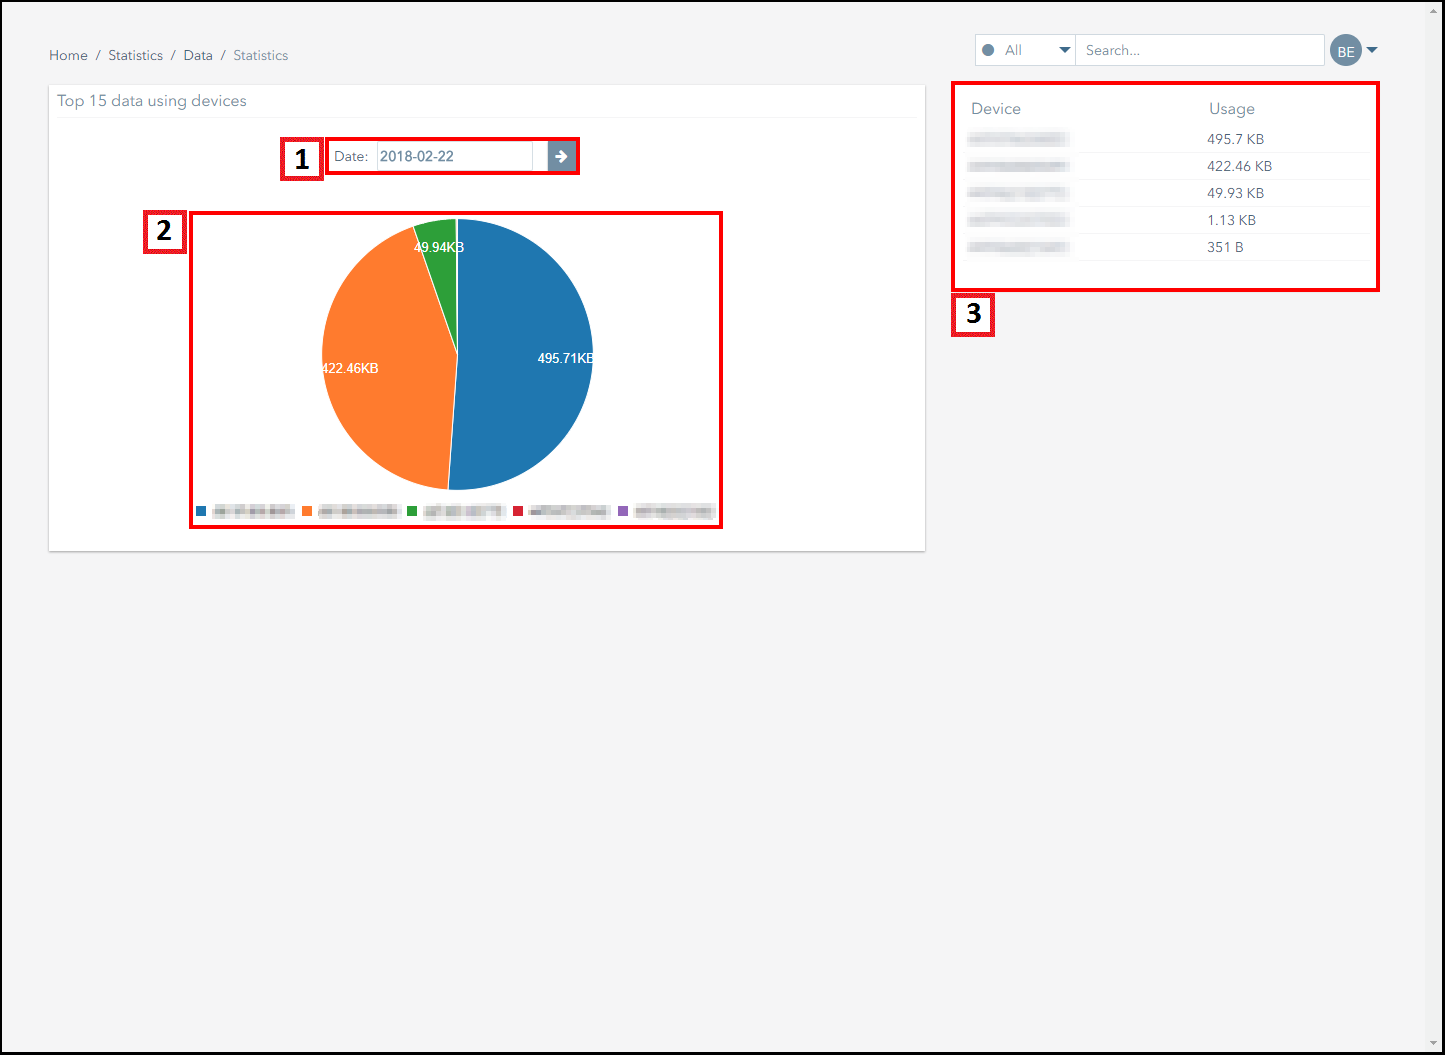
The following screenshot displays the Usage (By Device) page and outlines the steps to follow to modify the chart.
| Number | Description |
|---|---|
| 1. | Select the end date for the period you want to view information for, and then click on the arrow button to generate the chart. The chart displays usage information from the start of the billing period, up to the date you select. |
| 2. | This chart displays the subscribers that have used the most amount of data between the start of the billing period and the selected date, up to a maximum of fifteen subscribers. Click on the key below the chart to add or remove subscribers from the chart. |
| 3. | This table displays the subscribers that have used the most amount of data during the selected period and specifies the amount of data they have used. Information is displayed for the top fifteen subscribers with the highest data usage. |
Ground and First Floor
St. Vincent Plaza
319 St. Vincent Street
Glasgow, G2 5LD