Statistics
The Statistics section is used to generate and view stats and graphs relating to your account.
This section:
- Provides navigation information about the Statistics section.
- Highlights the key actions that can be performed using the Statistics section.
Navigation
| Number | Description |
|---|---|
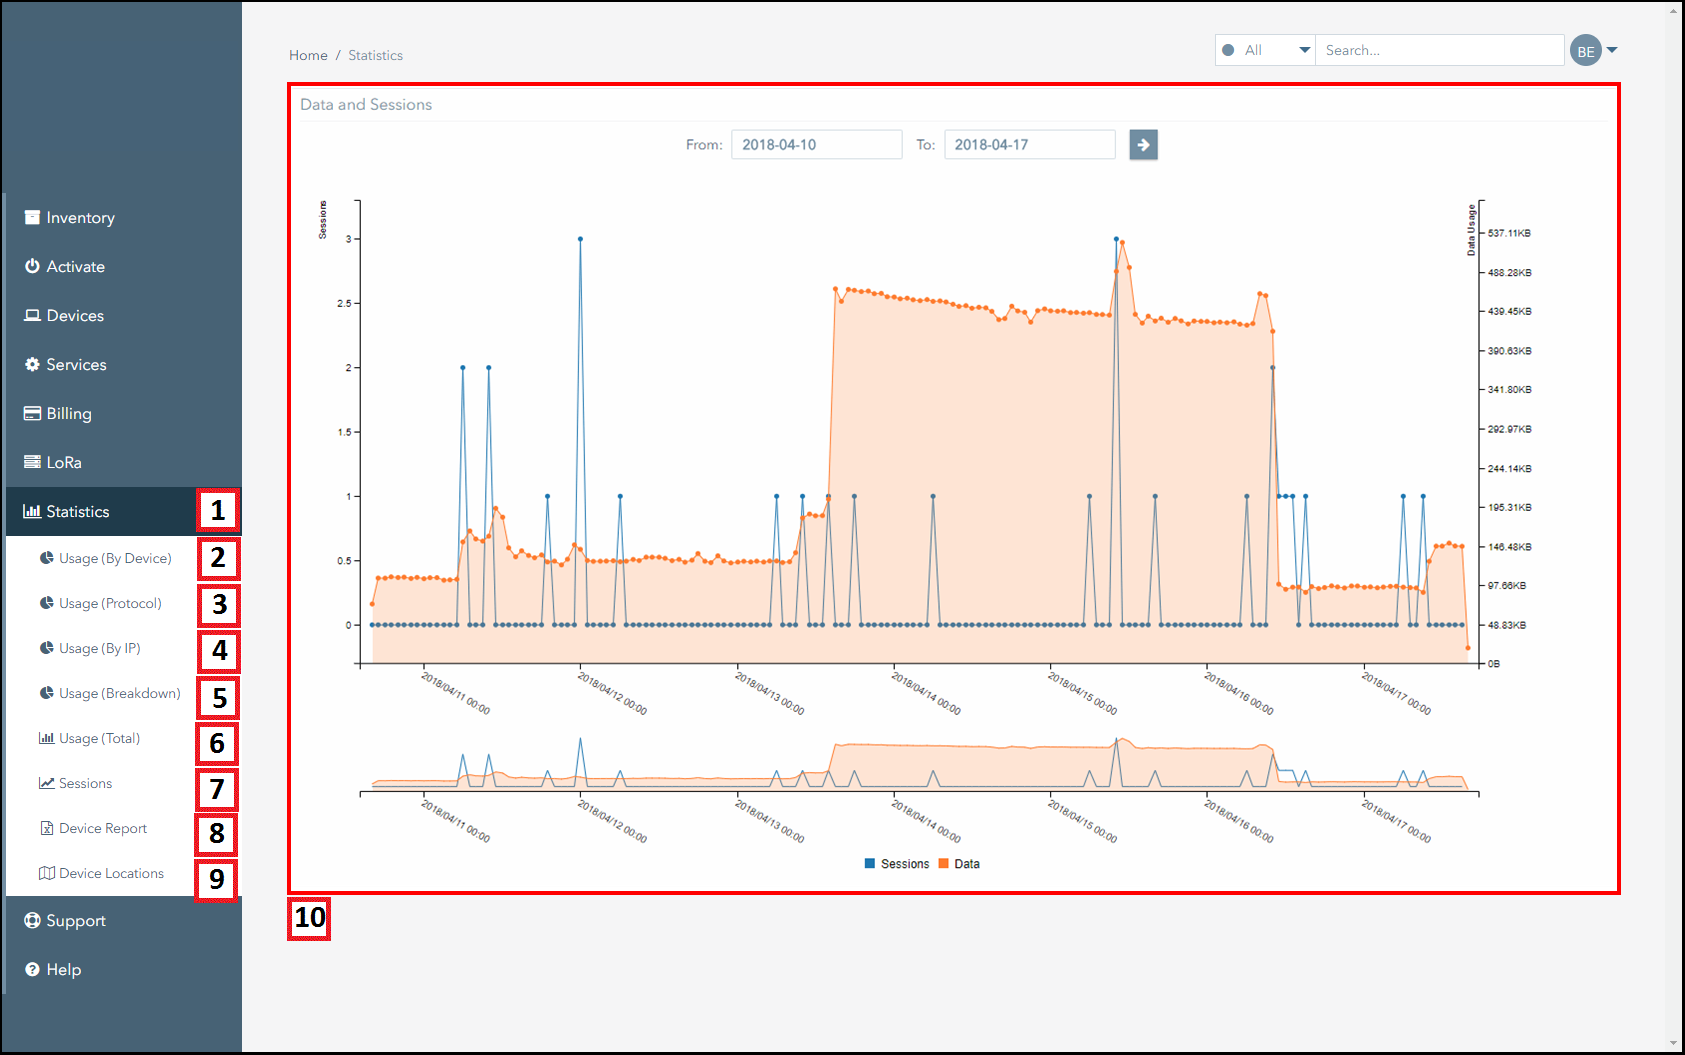
| 1. | Click on the Statistics icon to access this page. |
| 2. | Click on the Usage (By Device) icon to view the usage by subscriber page. Using this page, you can:
|
| 3. | Click on the Usage (Protocol) icon to view the usage by protocol page. Using this page, you can:
|
| 4. | Click on the Usage (By IP) icon to view the usage by IP address page. Using this page, you can:
|
| 5. | Click on the Usage (Breakdown) icon to view the usage breakdown statistics page. Using this page, you can:
|
| 6. | Click on the Usage (Total) icon to view the usage statistics page. Using this page, you can:
|
| 7. | Click on the Sessions icon to view the sessions statistics page. Using this page, you can:
|
| 8. | Click on the Device Report icon to view the report page. Using this page, you can:
|
| 9. | Click on the Device Locations icon to view the locations page. Using this page, you can:
|
| 10. | This graph displays the data usage plotted against session totals for the selected period. Using this graph, you can:
|
Ground and First Floor
St. Vincent Plaza
319 St. Vincent Street
Glasgow, G2 5LD