Generating Usage by Protocol Reports
The following screenshot displays the Usage (Protocol) graph and outlines the steps to follow to modify the graph.
You can view this page by navigating to: Statistics>Usage (Protocol).
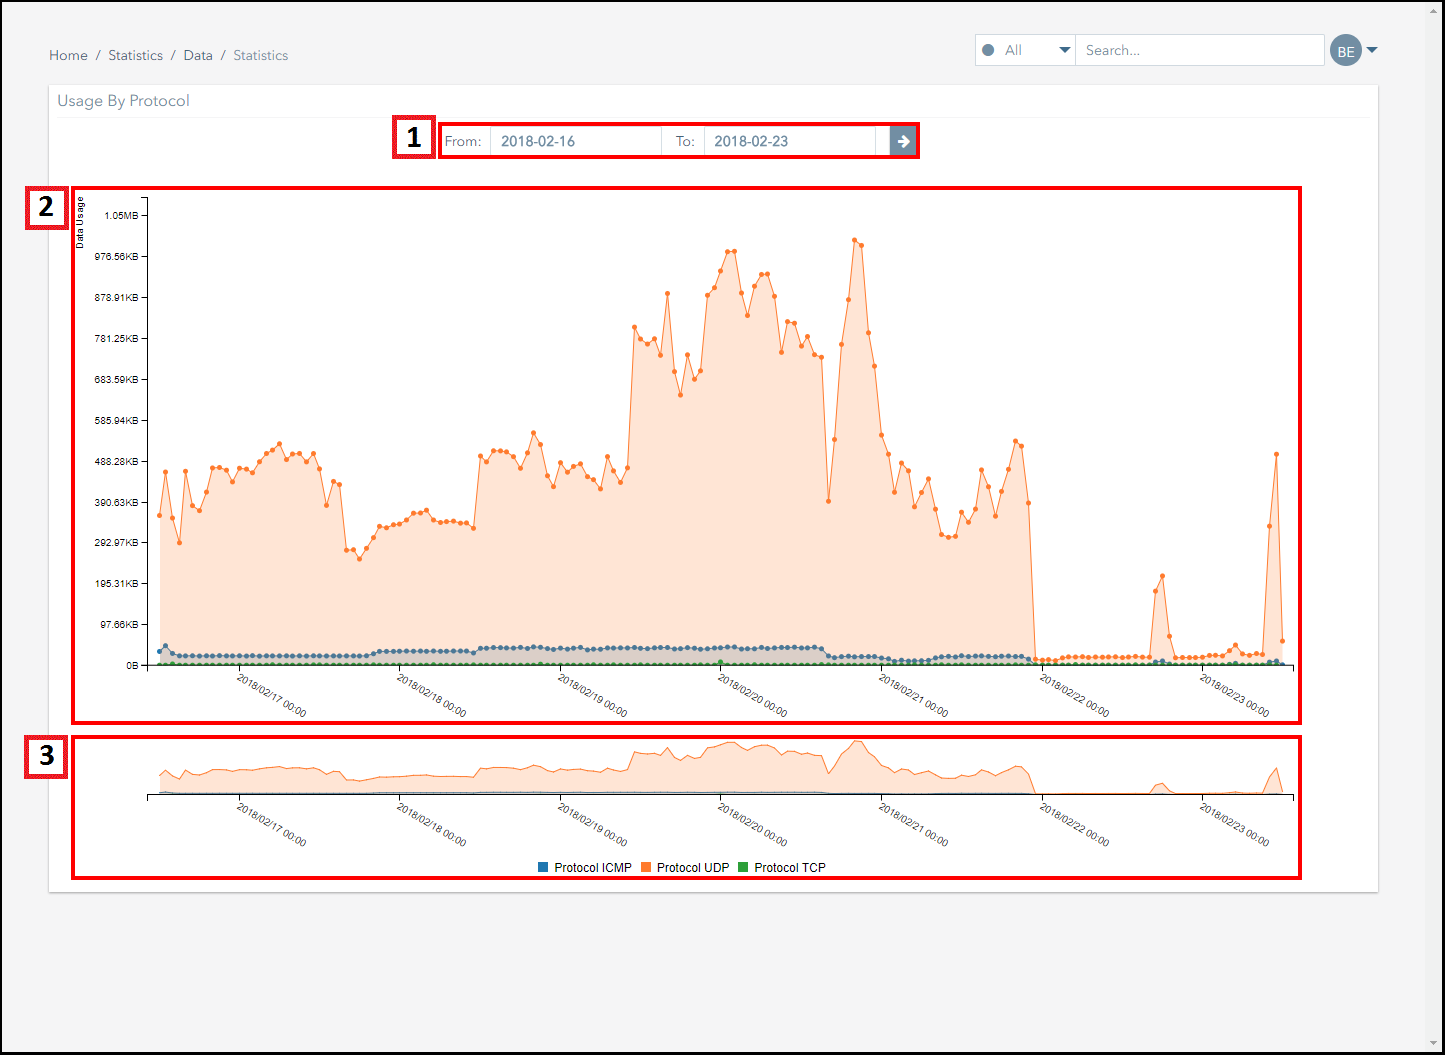
This graph displays the total amount of data used by subscribers during the selected time period, broken down by protocol type.
| Number | Description |
|---|---|
| 1. | Select the date range you want to view information for then click on the arrow button to generate the graph. |
| 2. | This graph displays the total amount of data used by subscribers during the selected time period, broken down by protocol type. Hover over the graph to view the usage totals for the period. |
| 3. | Click and drag on the sub-graph to view a more detailed breakdown of the information. Click on the key below the sub-graph to add or remove protocols from the graph. |
Pelion
Ground and First Floor
St. Vincent Plaza
319 St. Vincent Street
Glasgow, G2 5LD
Ground and First Floor
St. Vincent Plaza
319 St. Vincent Street
Glasgow, G2 5LD