Generating Usage by IP Address Reports
You can view this page by navigating to: Statistics>Usage (By IP).
This chart displays the total amount of data used by subscribers on the date selected, broken down by the IP addresses to which data was sent.
| Number | Description |
|---|---|
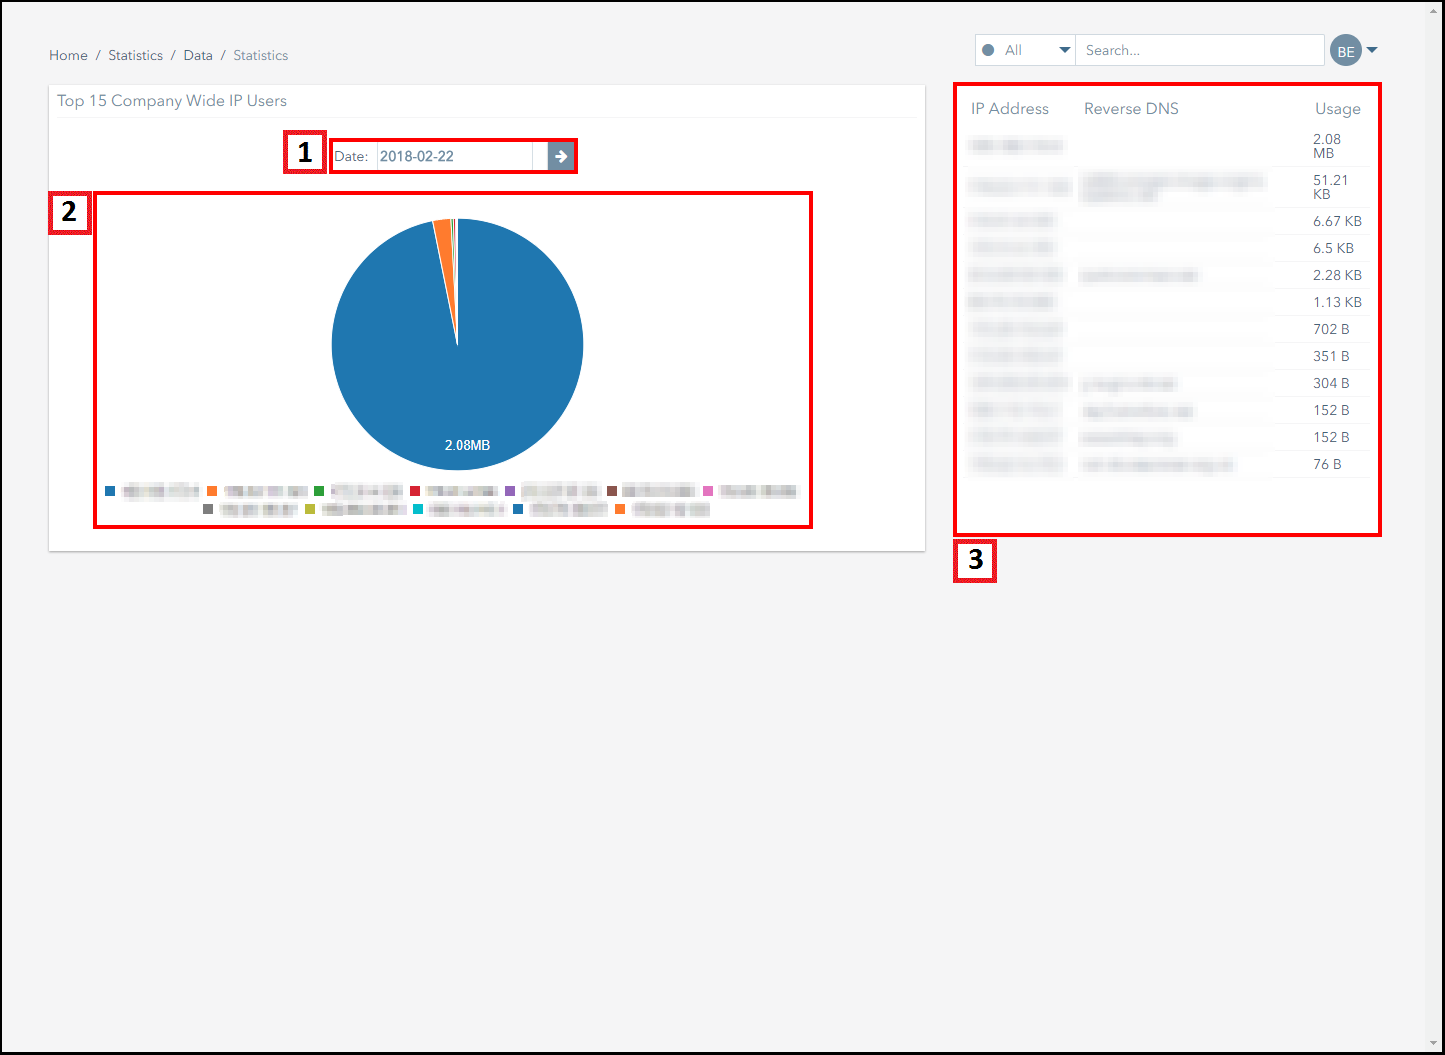
| 1. | Select the date you want to view information for then click on the arrow button to generate the chart. |
| 2. | This chart displays the total amount of data used by subscribers on the date selected, broken down by the IP addresses to which data was sent. It shows the IP addresses that have been sent the most amount of data on the selected date, up to a maximum of fifteen addresses. Click on the key below the chart to add or remove IP addresses from the chart. |
| 3. | This table displays the IP addresses that have been sent the most amount of data on the selected date and specifies the amount of data each address has been sent. Information is displayed for the top fifteen IP addresses which have received the most amount of data. The information displayed in this table includes:
|
Ground and First Floor
St. Vincent Plaza
319 St. Vincent Street
Glasgow, G2 5LD