Generating Session Reports
The following screenshot displays the Sessions page and outlines the steps to follow to modify the graph.
You can view this page by navigating to: Statistics>Sessions.
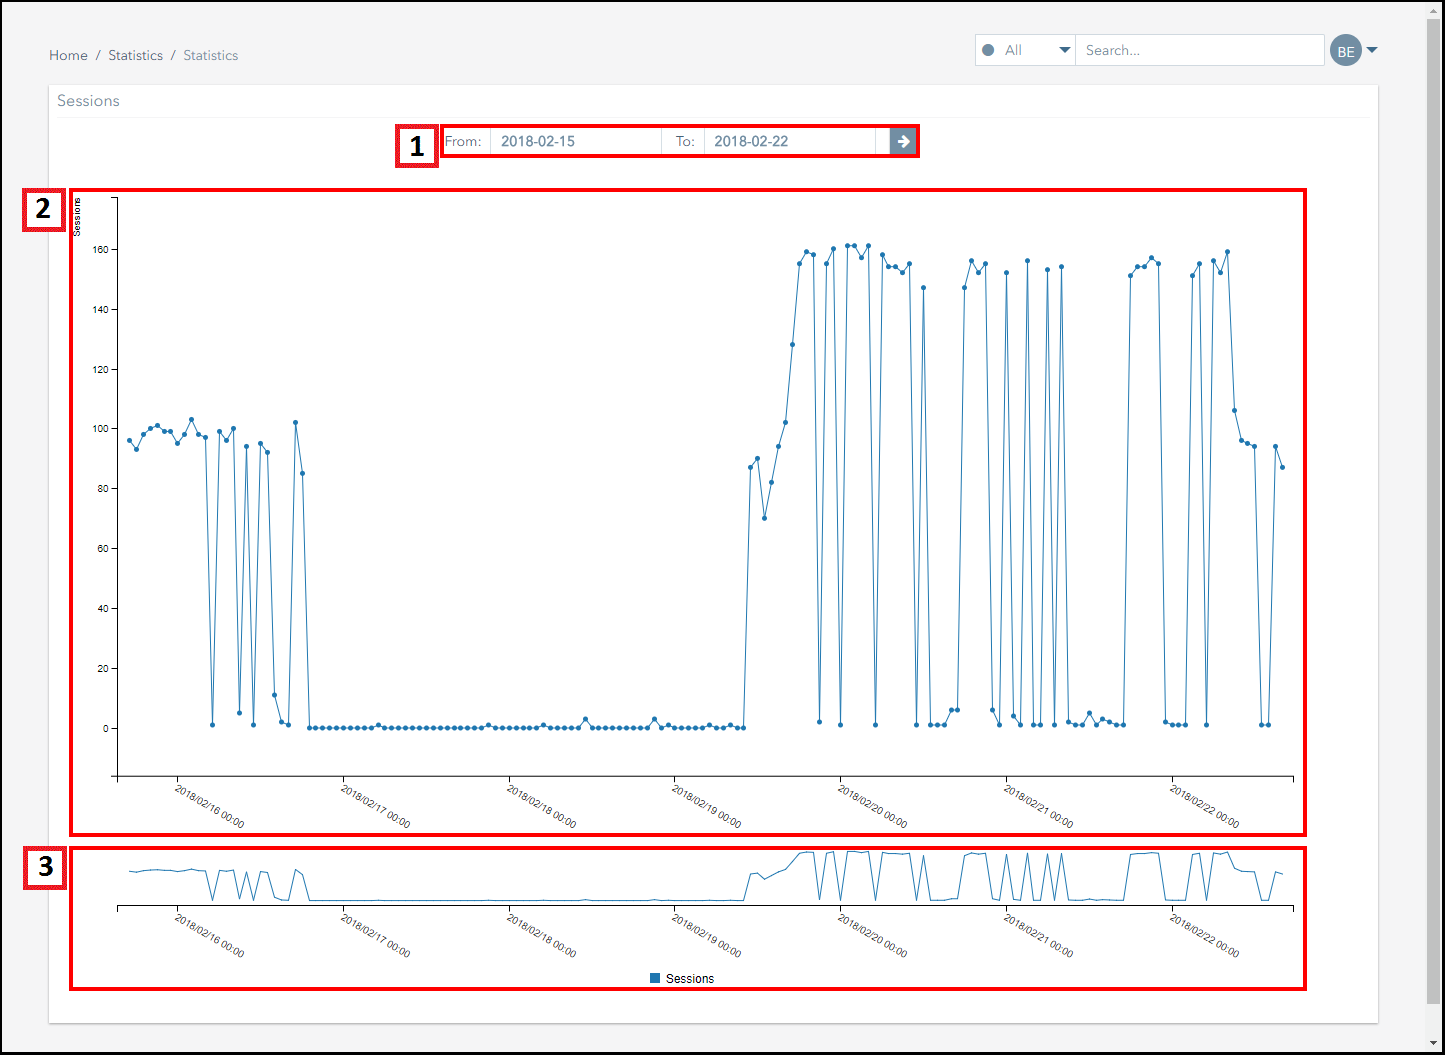
This graph displays the total number of sessions that occurred across the account during the selected time period, broken down by date and time.
| Number | Description |
|---|---|
| 1. | Select the date range you want to view information for then click on the arrow button to generate the graph. |
| 2. | This graph displays the total number of sessions that occurred across the account during the selected time period, broken down by date and time. Hover over the graph to view the session totals for the period. |
| 3. | Click and drag on the sub-graph to view a more detailed breakdown of the information. |
Pelion
Ground and First Floor
St. Vincent Plaza
319 St. Vincent Street
Glasgow, G2 5LD
Ground and First Floor
St. Vincent Plaza
319 St. Vincent Street
Glasgow, G2 5LD