Viewing Billing Stats and Graphs
This section explains the stats and graphs that are available in the Billing section.
The information displayed includes:
- A summary of the billable events that have occurred on your account in the current billing period.
- A graph displaying a breakdown of the daily charges accrued by your account for the current billing period.
- A table displaying a breakdown of the invoice totals for the account for the last six months.
Understanding the Billable Event Summary
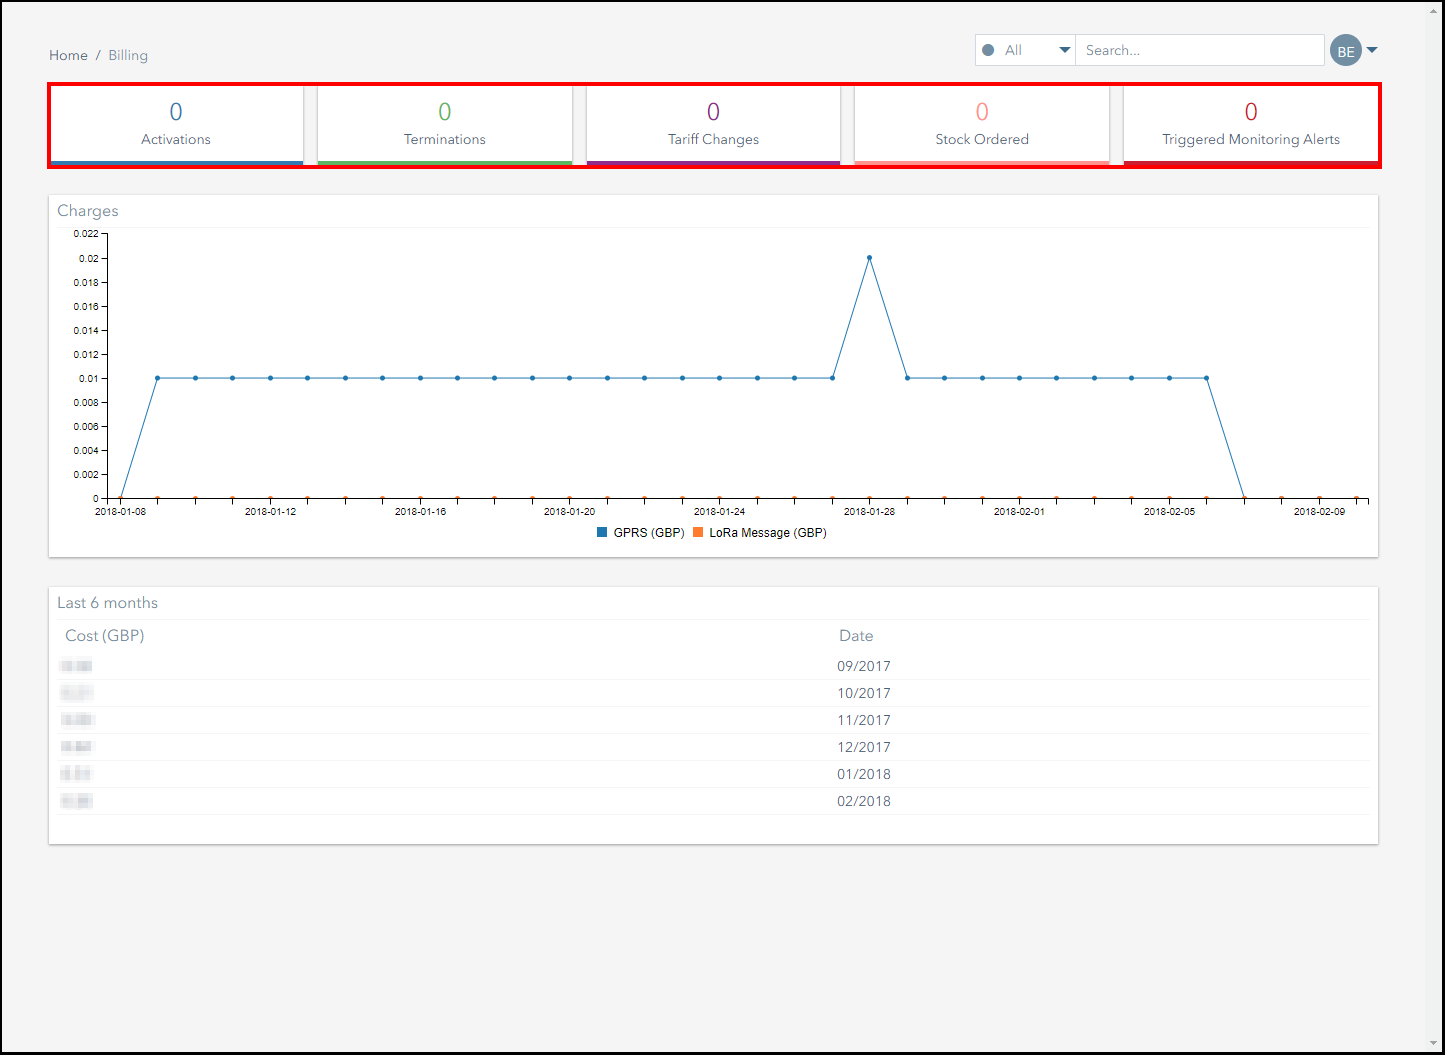
The billable event summary displays a snapshot of the events that have occurred on the account during the current billing period that will affect your invoice.
The events displayed in this summary include:
- Activations
This is the total number of subscribers that have been activated during the current billing period. - Terminations
This is the total number of subscribers that have been terminated during the current billing period. - Tariff Changes
This is the total number of subscribers that have been switched between tariffs during the current billing period. - Stock Orders
This is the total amount of stock that has been ordered during the current billing period. - Triggered Monitoring Alerts
This is the total number of monitoring alerts that have been triggered during the current billing period.
Understanding the Charges Graph
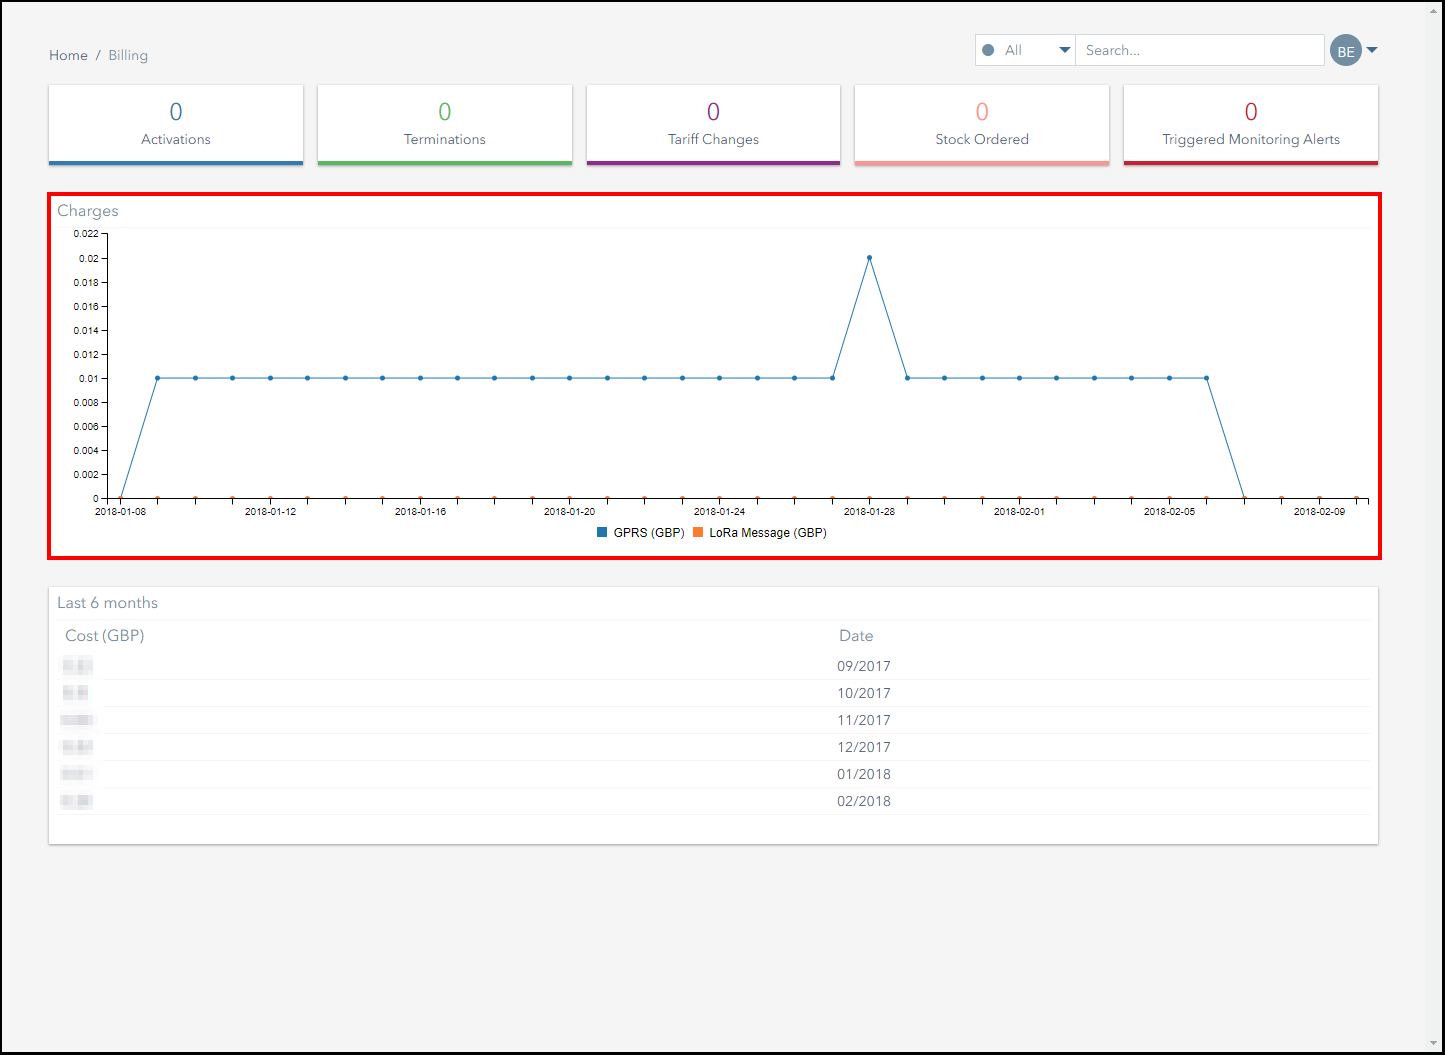
This graph displays a summary of the charges that have been applied to your account on a daily basis. This graph is useful for identifying your average daily connectivity costs and highlighting any daily totals that have fallen outside of the normal trend. The vertical axis represents the total value of the charge and the horizontal axis represents the date to which each total relates. Click on the key below the graph to add and remove charge types from the graph.
Understanding the Invoice Table
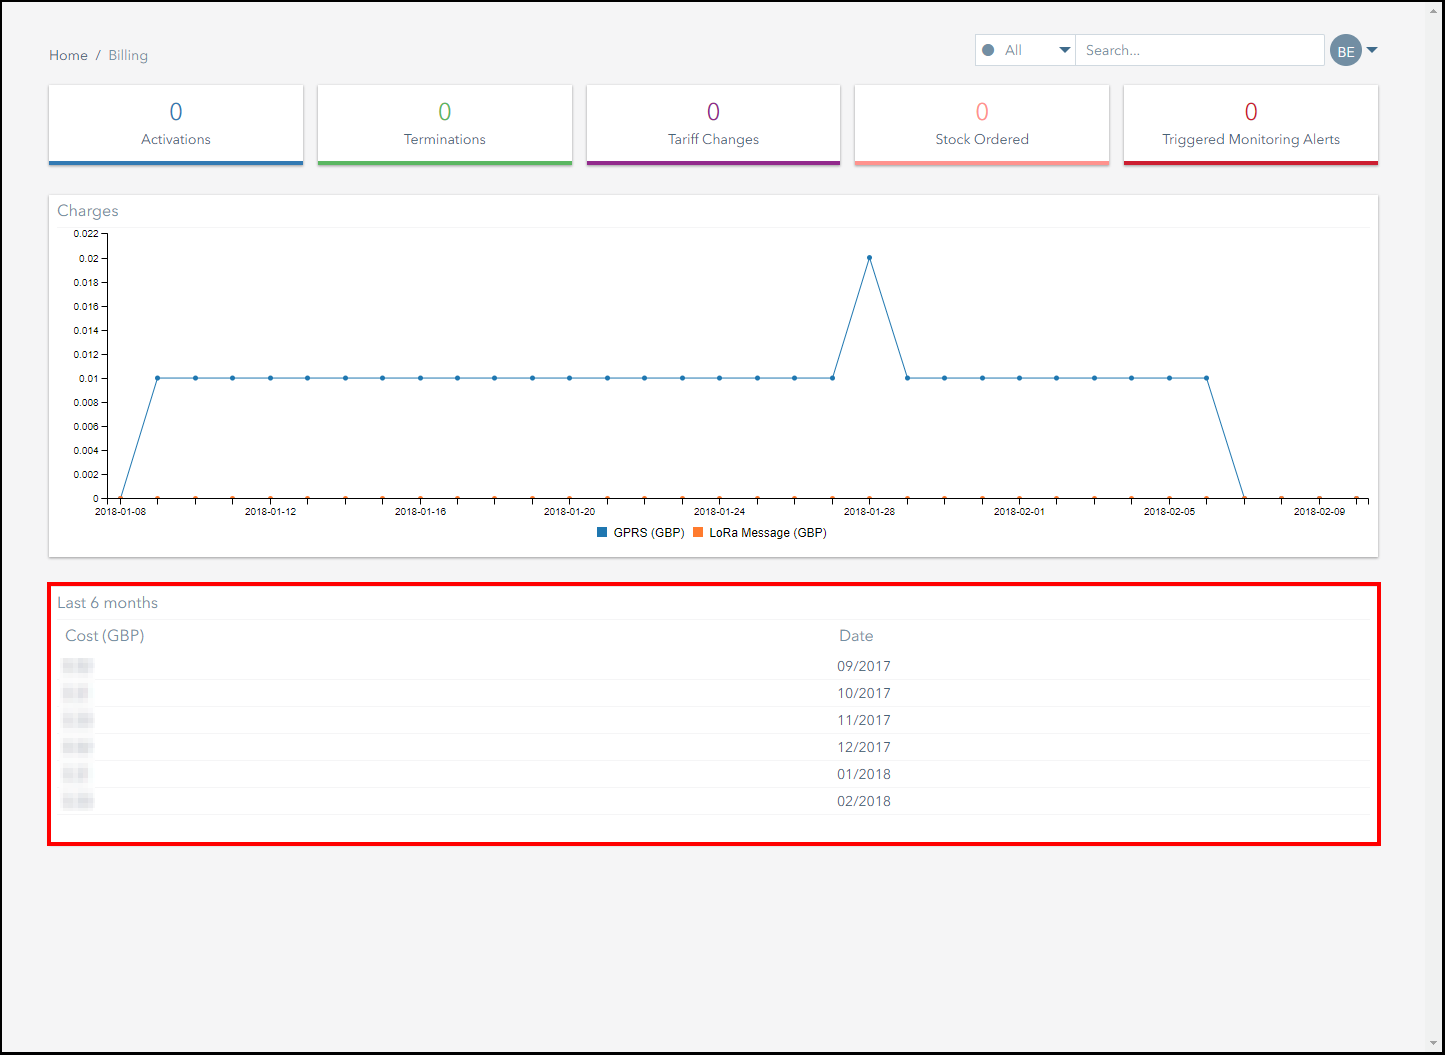
This table displays the invoice totals for your account for the last six months. This table is useful for identifying your monthly connectivity costs and highlighting any invoices that have fallen outside of the normal trend.
Ground and First Floor
St. Vincent Plaza
319 St. Vincent Street
Glasgow, G2 5LD