Cellular Analytics Tab
The Analytics tab allows you to view statistical and analytical information for an individual subscriber.
This section:
- Provides navigation information about the Analytics tab.
- Highlights the key actions that can be performed using the Analytics tab.
Navigation
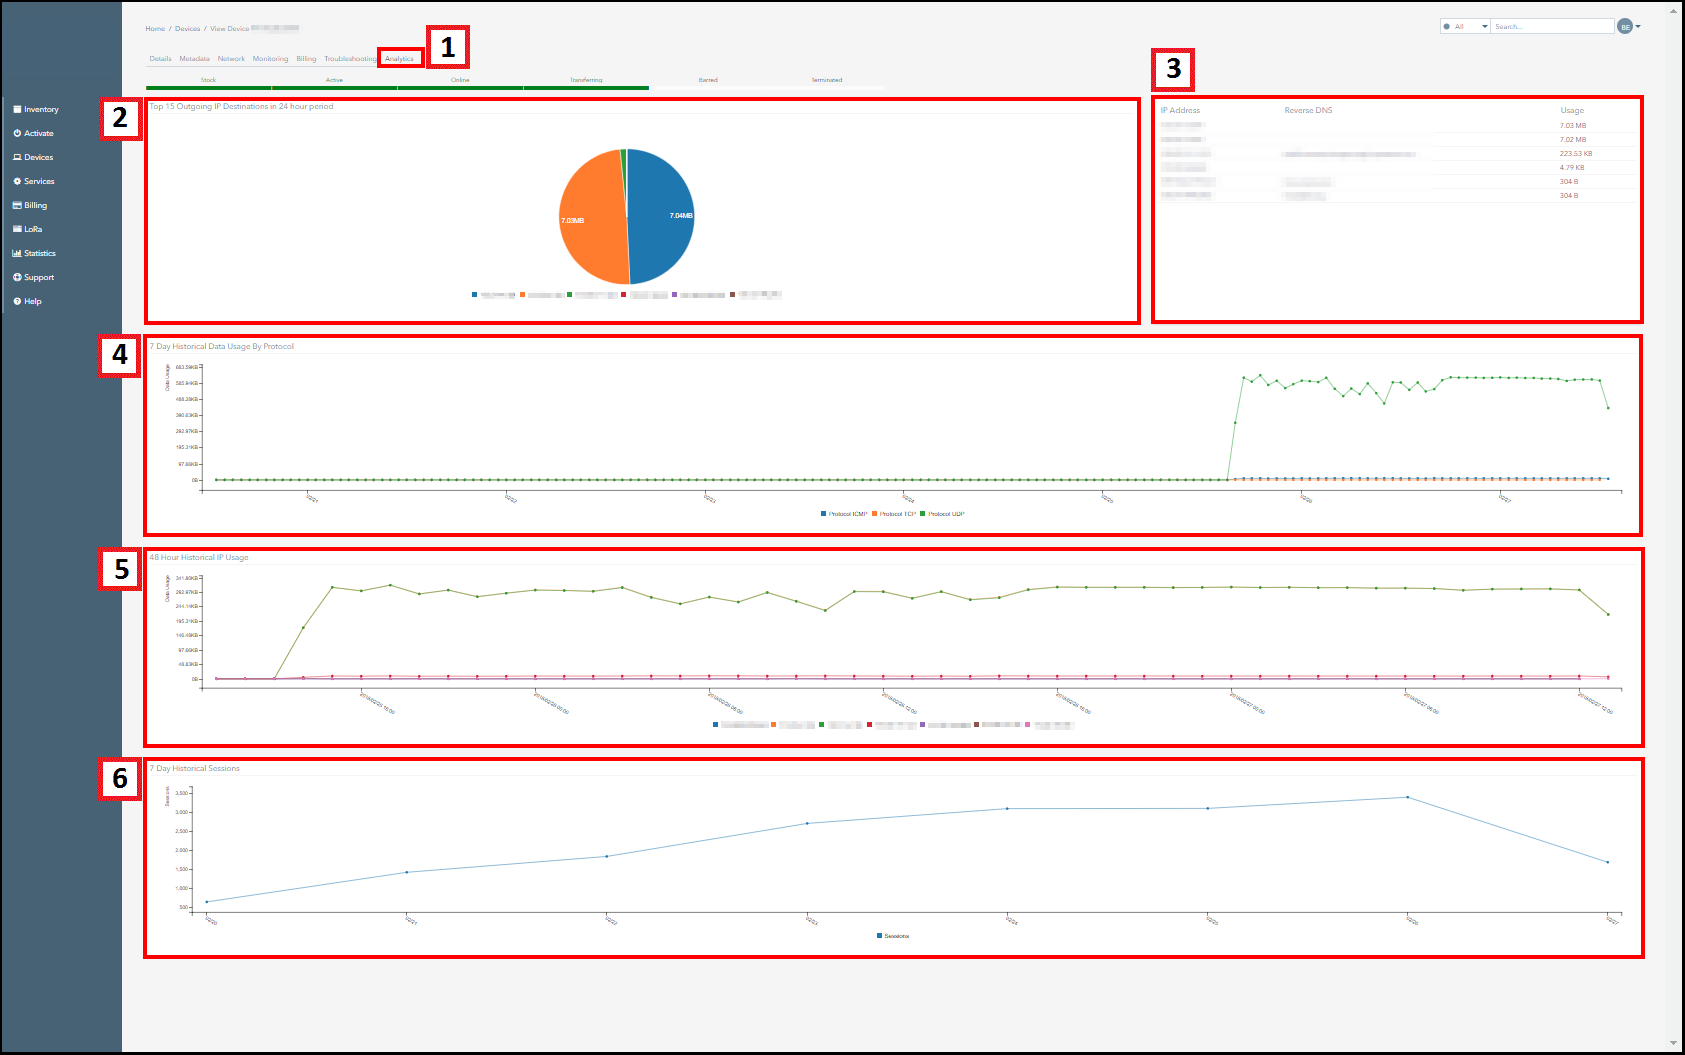
The following screenshot displays the Analytics tab of a subscriber's management page and outlines the key actions that can be conducted using this section.
| Number | Description |
|---|---|
| 1. | Click on the Analytics tab to access this section. |
| 2. | This chart displays the top fifteen IP addresses to which the subscriber has sent data during the last twenty four hours Click on the key below the chart to add or remove IP addresses from the chart. |
| 3. | This table displays the IP addresses that have been sent the most amount of data during the last twenty four hours and specifies the amount of data they have used. Information is displayed for the top 15 IP addresses with the highest data usage. |
| 4. | This graph displays the total amount of data used by the subscriber during the last seven days, broken down by protocol type. Hover over the graph to view the usage totals for the period. |
| 5. | This graph displays the IP addresses to which the subscriber has transmitted data during the last forty eight hours, broken down by usage. Hover over the graph to view the usage totals for the period. |
| 6. | This graph displays the total number of sessions that occurred across the account during the last seven days, broken down by date and time. Hover over the graph to view the session totals for the period. |
Ground and First Floor
St. Vincent Plaza
319 St. Vincent Street
Glasgow, G2 5LD